Each week I reverse engineer the products of leading tech companies. Get one annotated teardown every Friday.
Growth Dives: What Strava can teach you about survey design
How to write surveys that actually work: lessons from StravaThis is what good survey design looks like 😎 Read online here or download as PDF
With 150 million users, a 4.8-star rating on iOS and over 12 billion activities posted, Strava is one of the most popular fitness apps in the world. There’s even a Language Network Effect with the verb ‘to Strava’: Hey, did you Strava it? And, as the saying goes: If it’s not on Strava, it didn’t happen They also have a super strong Data Network Effect whereby years worth of activity data, photos and progress charts are stored in the app, thereby retaining users as they’re locked in, creating a defensible moat for the business. I’ve fallen in and out of love with Strava over the past 7 years — mostly depending on how active I’ve been But currently, I love it. So, when this neat little request landed in my inbox in April, I had no choice but to answer the call: a research survey.
Little did I know I was in for a treat:
In this post, I’ll break down:
What Strava asked — and how they asked itBefore we get into what made this survey so well-designed, it’s worth considering the raw materials: the questions themselves. There were 17 in total — a mix of behavioural, demographic, and mindset-based prompts. Some were straightforward, others a little unexpected. Strava used QuestionPro — I noticed this from the URL and the watermark below the questions.
Here’s the full question set, and I’ve added a category for the type of question: 🔑 Question key
🧾 Full question set (in order, with emoji tags)
(You can also see the full list in this Figjam file in the order they were asked.) At the end, I’m asked if I want to join a wider study, consisting of a 45-minute call and follow-up interview. All for $60 per hour (a total of $120), which is very strong in my view.
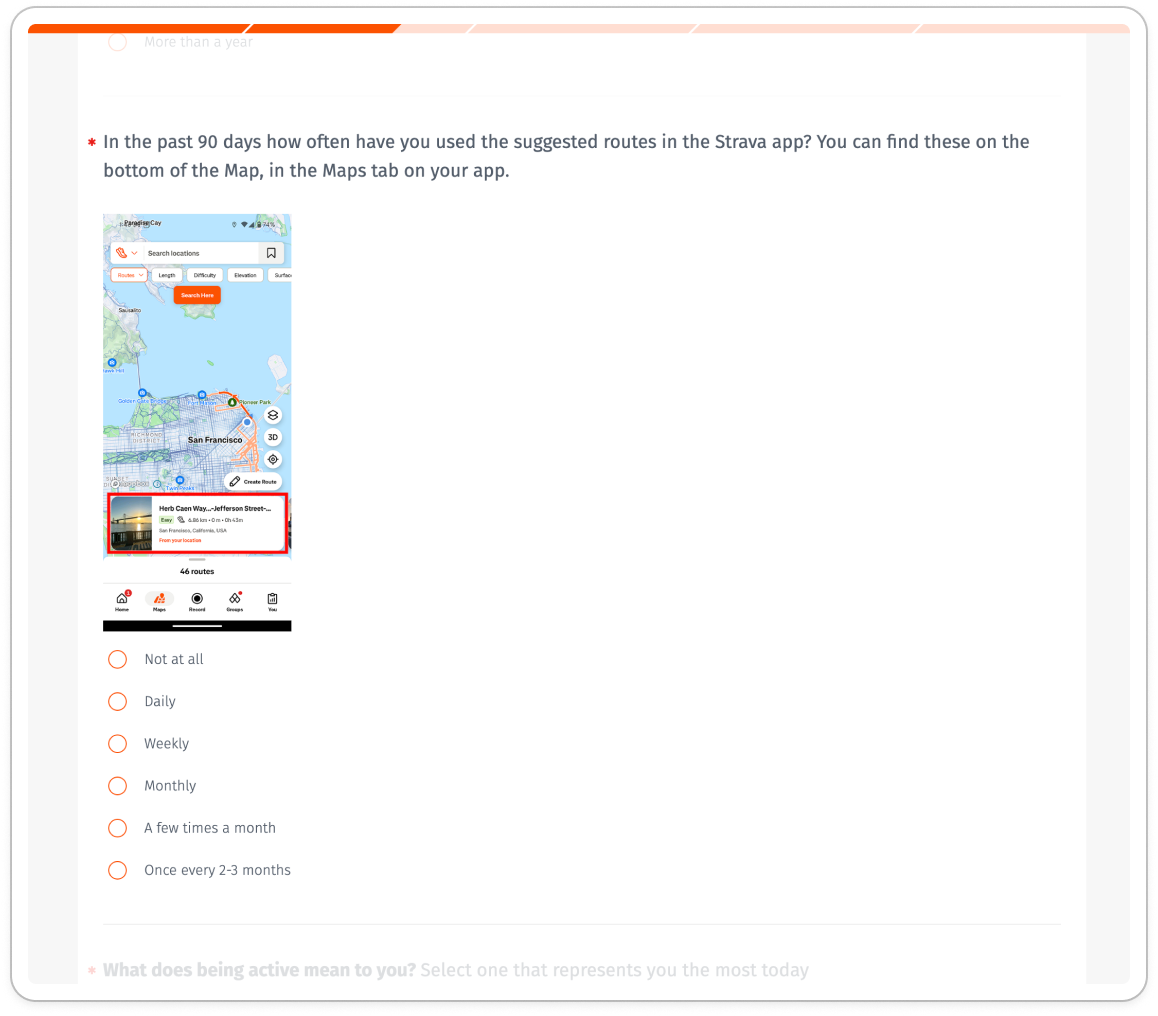
What stood out to me from these questions? Actually quite a lot. Here are 8 green flags that made it work so well: ✅ 8 green flags about this question set1) Captures both behavioural and attitudinal data“How often are you doing routes you are familiar with?” vs. “What does being active mean to you?” mixes what people do and why they do it. Demographics (age, gender, ethnicity) alongside psychographics (competition mindset, activity meaning) allow for some really rich segmentation. 2) Avoids leading questionsQuestions are phrased neutrally; there are no “right” answers or emotional nudges. ✔️ What’s your experience with Suggested Routes? ✖️ How helpful have you found Suggested Routes? ‘If any’ or ‘if at all’ can be helpful when you need to write a direct question, like Strava’s question, “Which apps, if any, do you use to plan or find routes?” 3) Ask one thing at a timeNo double-barrelled questions, every question is focused on one variable. ✔️ How satisfied are you with route accuracy? ✖️ How satisfied are you with the accuracy and variety of routes? Double-barrelled questions make it hard for users to answer clearly — if they feel differently about each part, you won’t know which aspect they’re responding to. 4) Anchor questions in timeTime-based framing like “In the past 90 days…” helps anchor responses in real, recent behaviour. This improves recall and precision (as soon as it starts to get too long ago, people forget, and data quality goes down). ✔️ In the past 3 months…” or “On your most recent ride…” ✖️ “Usually” or “Often” 5) Gives examples in contextHelpful microcopy like “You can find these on the Maps tab” makes it easier for users to orient themselves. It reduces ambiguity and increases response quality — especially for casual users who may not know feature names.
6) Inclusive and respectful languageThe questions are written in a way that’s less deterministic and more subjective; instead of ‘what are you’ it’s ‘how do you see yourself’. Questions also allow for multiple selections. ✔️ How would you describe your gender? (Select all that apply) ✖️ What is your gender? This isn’t as common as it should be….. 7) Builds on previous responses to go deeperSome questions are smart follow-ups based on earlier answers, which lets Strava dig deeper: “Which apps that you’ve selected do you pay for?”
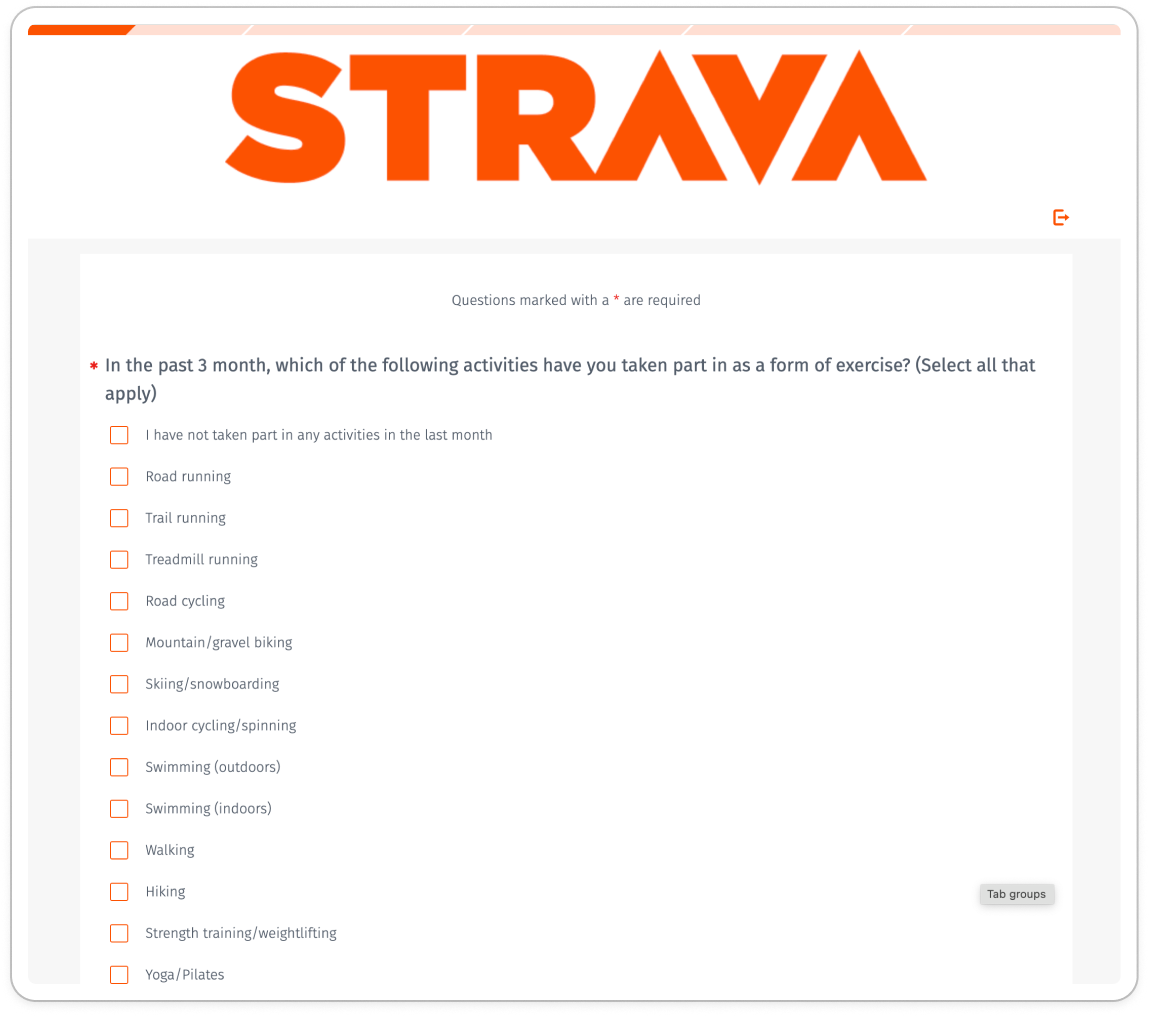
This keeps the flow efficient while collecting richer, more actionable data. 8) Minimises friction with multiple choiceWell-structured closed questions keep the effort low and make analysis easier — ideal for larger sample sizes (which I suspect this has). All the questions here are ‘closed format’, i.e. they have a fixed set of answers for the respondent to choose from. It promised me a 3-minute survey, and I completed it in 4 minutes. Still short, and I suspect screenshotting each question took up a fair bit of time. If I had to change just one thing…Even with all the green flags in this survey, there was one big gap that stood out. It won’t capture my behaviour accurately. Why? Because it missed the most important detail: which sport I’m talking about. One of the earlier questions asked me about sports, and I selected a lot.
Road running, trail running, road cycling, indoor cycling, swimming outdoors, swimming indoors, walking, hiking, strength, yoga… 10 in total. I’m not doing all of them every week — but they all show up regularly enough to matter. For each, I have different route-mapping and competition mindsets:
The survey lumps them together. Which means any insight it pulls from my responses is going to be blurry at best — or just wrong. How many people are multi-sport? I’m not sure, but I’d bet it’s at least a third, maybe even 50%. That’s a big chunk of users whose motivations, behaviours, and planning habits might not fit neatly into a single bucket. Additionally, I don’t plan routes when I’m at home. I know my area. The only time I used Strava routes is when I want to go for a run on holiday. In my mind, when answering the questions, I was answering for a mix of running and cycling (two big ones for me). Which isn’t ideal for the data quality. So, what is Strava really trying to find out?At the start, I wasn’t sure. But by the end, three research goals stood out:
It’s a well-structured survey, with smart logic and thoughtful language. But even great surveys can miss nuance. Especially when you’re designing for users with overlapping — and sometimes competing — behaviours. The lesson? Data quality starts with clarity, not quantity. You don’t need 50 questions or 50k users — you need the right framing, structure, and context to make answers meaningful. With Strava, I’d have asked a follow up question ‘what’s your main sport’ or ‘which sport do you spend more time on’ to help improve data quality and make sure any conclusions from this research are as robust as possible. In any case, Strava I’m still waiting for my user interview 🫶 Speak soon xox Thank you SO much for reading (all the way to the bottom, wow look at you go). I've seen so many cool bits of UI this week, it's hard to choose for next week. We have:
Let me know what you vote for! See you next week, Rosie 🕺 |


Growth Dives
Each week I reverse engineer the products of leading tech companies. Get one annotated teardown every Friday.